Unit 12: Overview & Assignment
Unit 2 Launch: Monday Oct 3 2016
Lucy’s Opening Intro/Talk on Maps and Mapping
How can designers map?
How does mapping lead to new ways of seeing?
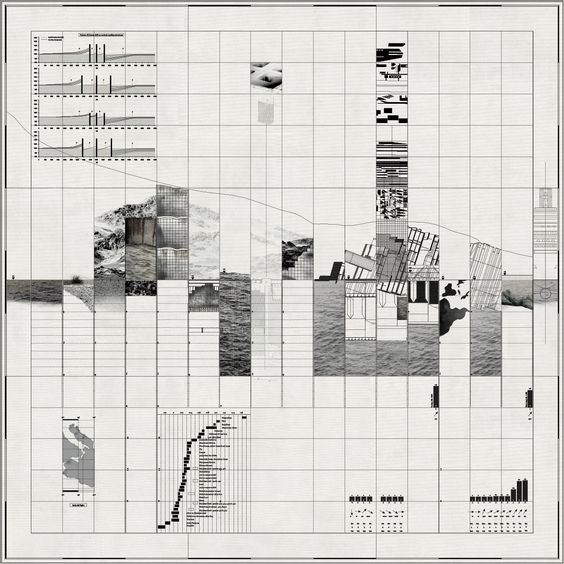
This Unit is about exploring the visual language of maps and as a way to express interests, opinions, observations, or points of view about a physical site and its attending associations, stories, qualities, and intersections.
“Maps can lie, wield power and even start wars. But Mapping, which describes the process of selecting and plotting information spatially, suggests a way of looking beyond the finished artefact, thereby eluding the charges leveled against the map. In recent discourse, mapping emerges from the ashes of the imperial map in a blaze of hopeful rhetoric: it is participatory, generative, revealing, enabling, performative.”
—P. Hall, 2012 from On Mapping and Maps
In the simplest terms, maps are print- or screen-based images that represent land, boundaries, location, or geography. They are produced by cartographers and work to simplify and reduce physical reality into useful and useable 2-dimensional tools.
But some maps describe political, social, artistic, even personal data; they can be factual or fictional; they can be subversive and persuasive. Maps can help to make arguments, point out problems, express quantity, and identify detail. Maps can aggregate one kind of information while omitting another altogether. Maps can act like a lens on a place or frame a point of view.
Learning Goals:
To experience both the craft of making —— and the task of communicating —— with reductive visual elements such as the kind often used in the world of maps and mapping.
To develop a sensitivity to place and space
To practice research methods
To learn to read a site
To transform observations into data, and data into stories
To learn to mine a place for message, idea, story, opinion
To practice abstraction: the act of translating information into readable, abbreviated, and condensed form.
To develop a visual language that can be understood by others.
To become aware of the kinds of work (theoretical, practical, or art-based) that is being produced in the world of mapping, and to see how it might impact a designer’s practice.
In this project you will choose a location — a “site” — to map (ideally near RISD). You will study your site and working from the materials you gather in your analysis, you will explore the possibilities that lie within the language of mapping. The goal will be to design a collection of maps based on the information you uncover and observe about your site, and the stories that might emerge from your observation.
For Mon Oct 3 / First phase
Choose a public site:
Select a site that is meaningful to you in some way.
If possible, it should be a short walking distance of the Design Center.
The site can be an important, interesting, or banal location. It can be a place that is politically or emotionally significant to you, or visually & sensorily compelling. It should be a place where people gather or pass through, such as parks, squares, memorials, monuments, plazas, street corners, etc.
It can be heavily or sparsely populated, but it must be a public space in which people gather or move through with some frequency.
It should not be so big that you can’t visually take it in at once.
Make a quick analysis of your chosen site:
Make note of each of the following 15 aspects / characteristics / qualities (make notes, keywords, photos, sketches). Visit your site at least twice, day and night. Feel free to identify other characteristics not listed here, but include at least these 15:
Categories of Observation (aka Domains)
- Users How do they move through, what are the trajectories, what is
the purpose - Behaviors What are people doing and why are they there? What else is there? Animals? Cars? Children?
- Functionality What is the site used for
- Structures Built or existing elements, lamps, hydrants, benches, pavements, trees, etc. How did they get there, what is their use?
- Material qualities What is the predominant material, underfoot, at eye level, above; how do materials intersect or join?
- Sensory qualities What are the smells, sights, sounds; do they change at different times of day
- Scale Is the place Big Small Cozy Open Closed, etc.
- History What is the site’s history, its reason for being, significant moments or events
- Progression How has it changed; is it still changing
- Geology What lies beneath it; what is its geologic story
- Physical Geography Where is it, how is it shaped and located
- Social Geography Are there class, economic, or civic distinctions or intentions
- Personal What do you feel, think, remember about this site
- What could this site be used for Future potential
- Problems What needs solving or improving
Unit 12 Schedule — Maps and Mapping
Due for Wed. Oct 5 Dig Deeper and Start Mapping
Choose 8 of the 15 categories of observation and do further research and ideation. Show visual evidence of any and all research accomplished. Begin your 8 mappings (size: 10 x 10 in.) one for each category of observation; show drafts/beginnings for 4 mappings.
Due for Mon Oct. 10
Show 8 mappings, on the wall. Show any supportive research.
Consider: layers and strata in your methodology. Consider the relationship between visual mode and meaning. Consider what to show and what to remove
Considerations
Digging deeper and starting mapping
As you commit to 8 (out of 15) categories of observation, be comprehensive as you learn more about your site and begin to develop a position, a statement, or a point of view. The depth of your research should help you determine what (and how) you want to say with your maps.
Mapping
You are graphic designers exploring and innovating around the visual language of maps and mapping. Make 8 visual mappings/maps based on each of eight chosen categories. Your maps should be square —— 10×10 in. (or bigger) and while they can be quick and relatively simple, you should pay close attention to the method you use to visualize your content. How are you controlling your presentation of the information you are expressing. What kind of line, type, image, message. Is a key or legend needed to understand your visual grammar or symbology. How are choosing to simplify, condense, communicate?
Your maps/mappings can be expressive or unconventional but should be legible in some way. They should communicate, and consider appropriate methods and intended message. Develop, and experiment with, different modes of visual language and mapping expressions. You are reducing, simplifying, editing, highlighting, quantifying and locating certain elements. What visual forms make sense for your point of view?
Your 8 maps should attempt to simplify, signify, communicate:
Use the following visualization modes. Choose methods for expressing or delineating your information appropriately:
- Line and shape (vector, hand drawn)
- Graph and symbol
- Image (Photograph, drawing)
- Word (text and type)
- Color (how can color be used to identify certain characteristics)
- Pattern (for differentiation)
- Keys or Legends (for helping your readers)
There will be two more phases;
Then the project culminates on Oct 19
and will end with an exhibit in the GD Commons.
——
Final Phase
Due for Wed, Oct 12
— Show your 8 mappings, refined, and show /proposals/beginning drafts for a 9th more open “map” (This time the dimension and media and form and message are completely open and the focus becomes a more editorial voice, an opinion or point of view). This 9th mapping is the edit. This 9th mapping is the story. It represents what you want to say having done the work of the first 8 mappings, which were your search and research. This final mapping can either utilize aspects from your previous 8 maps or present a new form altogether. How do you stage and frame the story? Consider the installation of your work and the role of typography/language to communicate your project.
Due for Mon Oct 17
9th “map” (new work) show iterations, versions
Due for Wed Oct 19
All 8 maps plus new 9th “map.” Also consider introducing the work back into the site and documenting the site.
Meet in the COMMONS to install the work in an exhibit.
Monday Oct 24 Unit 12 Crit in Commons.
The 9th map
Media for this final “map” is open. This new work should tell a story about the site, or about some component of the site, and should emerge from the first 8 rounds of exploration. It can use elements designed in the first 8 maps, or begin a whole new approach.
A final (optional) step: introduce your “map” to the site!!
Bring an element of your map(s) back into the site itself.
Consider the hows and whys of this / discuss in class–
Media is up to you. Document the final work.
Final install / exhibit in GD Commons Oct 19
Crit in Commons Oct 24
Include:
- Your 8 maps
- Your 9th map
- Documentation of the site with map element(s)
——
From “Between the Map and the Territory”
A thesis by C. Fisher Schwartz
“The map is demonstrative of a basic human impulse, the desire to understand our surroundings and our position within the world. Through the activity of mapmaking, we aspire to comprehend comprehensively, but the very nature of the map allows for only partial understanding. Despite this objective for total knowledge, the blank space of a map is a necessity; in order for a map to be useful it must leave some aspects out. This blank space, along with other blanks in visual representation, is an active silence, and holds meaning in its absence.
While the map attempts to represent a territory, the two become conflated as the map shapes our perception of the space it depicts. As mapping conventions become normalized, the map appears to be an authoritative depiction of a physical space. However, it presents not only what is sensed in the world, but an accumulation of knowledge constructed by society. The map can never reproduce the terrain, but rather combines the real with the representational scheme, the natural with the ideological. We do not simply traverse the physical world but an architecture constructed by the lines of the map.
If exploration is the act of forming a world, then un-discovery is the act of taking it apart, akin to the fracturing of post-modernism. However, in the dissemblance of uncertain times, there is an opportunity to visualize new, alternate spaces, to reconstruct through imagination.” — Carla Lacey Fisher Schwartz
“The city is a living entity, [it is] something far more than a clever configuration of lines. The city changes every day, every hour of the day. It is constantly modifying itself. And it is fully alive in the way it reacts and responds to our actions. It is endlessly fascinating in the same way humans are. They can be exhausting, they can be destructive. But they contain endless possibilities too.” — Rafael Schacter, curator, A(by)P
Links and Resources
(feel free to add more links)
http://www.brooklynstreetart.com/theblog/2015/01/21/50-ways-to-map-the-city-per-street-and-graffiti-artists/#.V_EYopMrLMV
http://learning.blogs.nytimes.com/category/lesson-plans/geography/maps/?_r=0
Watch this
https://www.l2inc.com/about
And then right after watch this (risd alum) Nick Felton:
https://www.youtube.com/watch?v=jpLrq881tGk
Note the way data becomes simplified and mapped to various and multiple categories. How is it persuasive? How is it not?
http://www.janetzweig.com/public/WESTSac.html
https://www.youtube.com/watch?v=ldSkPqZKBl0
http://www.edwardtufte.com/bboard/q-and-a?topic_id=1
https://vimeo.com/117036240 Banjamin Bratton on Stacks
http://thirteen.fibreculturejournal.org/fcj-089-repopulating-the-map-why-subjects-and-things-are-never-alone/
http://marknystrom.com/
http://mapmaker.nationalgeographic.org/#/
http://mthvn.tumblr.com/post/38098461078/thecloudthestateandthestack
Data.gov / US gov’s open source data library, searchable by place (tons of resources for Providence!)
Open Street Map / an open source map resource
Stamen / cartography firm in Boston
NYT election story / excellent example of a clear story told through mapped data
Transit Maps / good blog focused on evolution of transit maps
Denis Wood / and his poetic maps of his neighborhood Boylan Heights, mapping street signs, graffiti, lamps, cars, jack-o-lanterns (This American Life)
his ‘signs’ map (PDF)
And
http://www.believermag.com/issues/201201/?read=interview_wood
http://www.deniswood.net/content/papers/Fine%20Line.pdf
http://visual-memory.co.uk/daniel/Documents/S4B/sem02.html
https://www.theguardian.com/technology/2012/aug/28/google-apple-digital-mapping
https://persuasivemaps.library.cornell.edu/ (thank you Michelle Devlin!)
